
REBALANCING UPDATE AND MARKET COMMENTS: July 2020
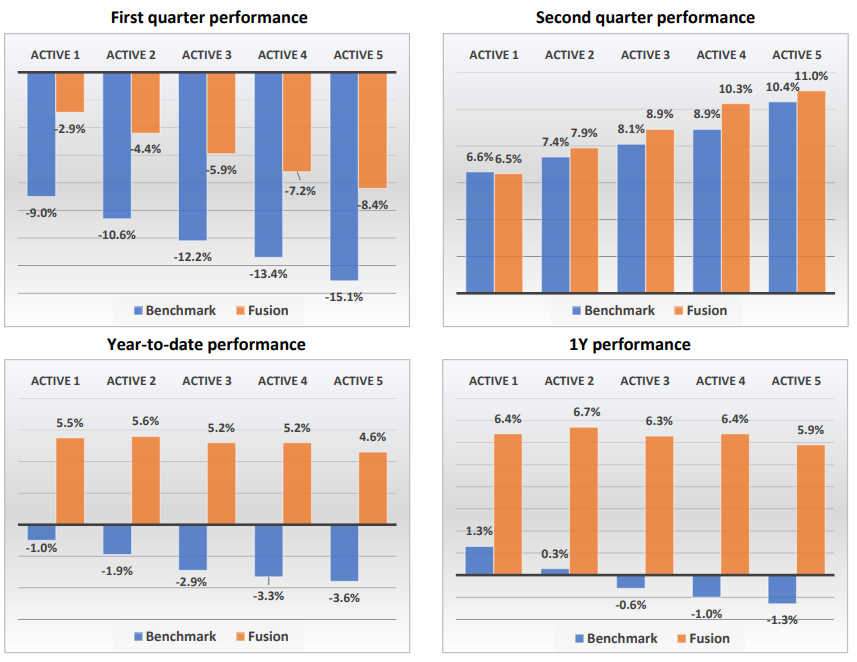
Since the previous rebalance in April all Fusion portfolios delivered strong returns between 5% and 11% in line with their corresponding benchmarks performance, following the recent markets recovery.
The longer-term comparison, as a better guide to the performance in volatile markets, shows very strong outperformance against the benchmarks for all Fusion portfolios, ranging between 5.5% for Optima to 8% for Active portfolios since the beginning of the year.
The long-term focus of Fusion on systematic investment protection, as well as the tactical conservative stance adopted at the beginning of the year, ensured the outperformance during the severe market stress. The carefully balanced mix of performance-driven and risk-driven models adopted for Fusion portfolios allowed to significantly mitigate losses on the market fall and at the same time to deliver the target performance on the market rebound.
Active Range
Since the last quarterly re-balancing the Active portfolios delivered strong returns ranging between between 6.5% for low risk to 11% for high risk portfolios, slightly outperforming their benchmarks by 0.5% on average.
Year-on-year return is around 6% across all of the risk levels and the outperformance of Active portfolios against the benchmarks since the beginning of the year is reaching 8% on average.
Optima Range
Fusion Optima portfolios performed strongly since the last quarterly re-balancing, with portfolio returns between 5% for the Defensive portfolio to almost 9.5% for the Generation portfolio, while they slightly underperformed the benchmark by 1% on average.
Year-on-year performance is positive for all programs, with the Optima range delivering from 4.9% return for the Defensive portfolio to 2.4% for Generation, with an average outperformance against the benchmark of 5%.

Alternatives
This year it has not been an easy market to trade, and, as always, there has been some outsized winners and losers. The most sophisticated investors, hedge funds, “smart money”, lost a record 7.9% in the first half on an asset-weighted basis, according to Hedge Fund Research. The losses were the steepest ever in data going back to 2008. Funds broadly fell (-0.4%) even in June, when the S&P 500 gained 1.8% to cap its best quarter since 1998. In this light, portfolios performance overall and, in particular, our selection in alternative space have done well both in Optima and, especially, in the Active ranges.
Market Commentary
Overall, we would characterize current markets as an unstable balance between improving economic data and a fear of worsening COVID outlook – hoping for the best, too afraid to miss the global rally, on steroids of unprecedented monetary stimulus, watching closely for any signs of a renewed trade war between the US and China.
The best illustration of the situation is the US market. After the recent secondary surge in virus cases, analysts expect lower US growth in Q3, reflecting a pause in the strong rebound in the consumer services sector. The COVID situation has worsened notably, with states representing more than half of the US population moving to pause or reverse reopening plans. Much of the population is still stuck at home, relying heavily on digital tools and investors have been bidding up tech shares. At the same time, pandemic-sensitive sectors like airlines keep sinking. Beyond the US, Goldman Sachs estimates that global GDP has now made up roughly half of the 17% drop seen from mid-January to Mid-April, with large gains in almost all regions.
Behind the recent market recovery is the fiscal and monetary support on the scale unimaginable in pre-COVID economies. Although the pace of additional macro policy easing has slowed over the past month, it has not stopped. More economies, primarily in developed markets, have eased fiscal policy further over the last month. The UK announced Phase 2 of fiscal easing and another round is expected in October. The EU agreed the “Recovery Fund” of €750bn, out of which a large majority (€390 billion) is going to be issued in grants and may not get paid back. In the US, analysts expect a fourth fiscal round worth another $1.5tn (7% of GDP), with $800bn implemented in 2020. Several central banks in developing countries cut rates over the past month – very unusual for them as previously they tended to increase rates during market unrests.
China’s strong Q2 GDP data confirmed a V-shaped recovery, which is taking the pressure off policymakers to ease. Yet, still the credit policy remains unchanged. Never before has the world seen this amount of money “printed” and given away.
This “free” money and improving earnings expectations fuel the market recovery. Price targets are grinding higher on average. The idea of taking stakes in small and medium-sized firms to avoid bankruptcies is closely examined by governments. The European Commission and the Bank of England have both floated the concept, and Germany’s economy ministry is now considering the strategy. This measure targets removing wide-spread bankruptcy risk and giving the everyday economy a chance to pretend that everything is back to normal.
This “wall of money” underwrites market risks and is pushing the markets up for now.
Re-Balancing Portfolios
Looking forward, we continue to combine strategic allocations through models with tactical adjustments, based on our current view of global markets.
On the asset allocation side, the models largely caught up with our tactical changes, increasing the weight of investment grade bonds which we already implemented during the last re-balancing. Another noticeable change is a considerable reduction of the commodity allocation – this is mainly due to the risk-budgeting component of the global asset allocation and the increased realized volatility for this asset class. The Investment Committee have also decided to increase the Alternatives allocation at the expense of Global Government Bonds, partially correcting the over-defensive stance of the portfolios compared to the benchmarks and partially to account for forward-looking negative returns on fixed income government instruments.
In terms of the asset selection there are a number of changes to the portfolios reflecting the main themes highlighted in the market overview.
Asset selection
Optima Range. In anticipation of the continuing out-performance of technology shares, we have introduced the Invesco Nasdaq-100 tracker, which substituted the Fidelity US Quality Income ETF, with an introduction of a 50/50 split between Nasdaq100 and S&P500 trackers for each portfolio. Similarly, a technology equity tracker has been added to European Equities with weights equally split between ESG, index trackers and Technology. The iShares MSCI Europe Minimum Volatility ETF was removed to accommodate the change.
The Renewables Infrastructure Group and iShares Global Infrastructure ETF are still the choice for Alternatives. In addition, part of the allocation was moved into the newly introduced SPDR Morningstar Multi-Asset Global Infrastructure ETF.
In Commodities, due to the large increase in the price of gold, which we added to the portfolios more than six months ago, the allocation to gold in the current portfolios has been brought down, locking the gains from the recent very strong rally.
Active Range. In Equities, the Fidelity Global Low Volatility Fund has been replaced by the Fidelity Index World tracker to generate a slightly more aggressive stance.
The Polar Capital Global Convertible Fund and the Fidelity Global Property Fund are still the choice for Alternatives. The re-allocation from Developed Government Bonds to Alternatives has been implemented through the newly introduced FP Foresight Global Real Infrastructure fund.
DOWNLOAD FUSION DFM REBALANCE COMMENTARY